
Guides
How the OreScore valuation model works
Follow one real company, Aris Mining, through the five steps of the OreScore calculator, from the market snapshot to NAV per share. Every number below is reproducible in the calculator.
Load the Aris example into the calculatorOpen the mining stock calculator
Market snapshot
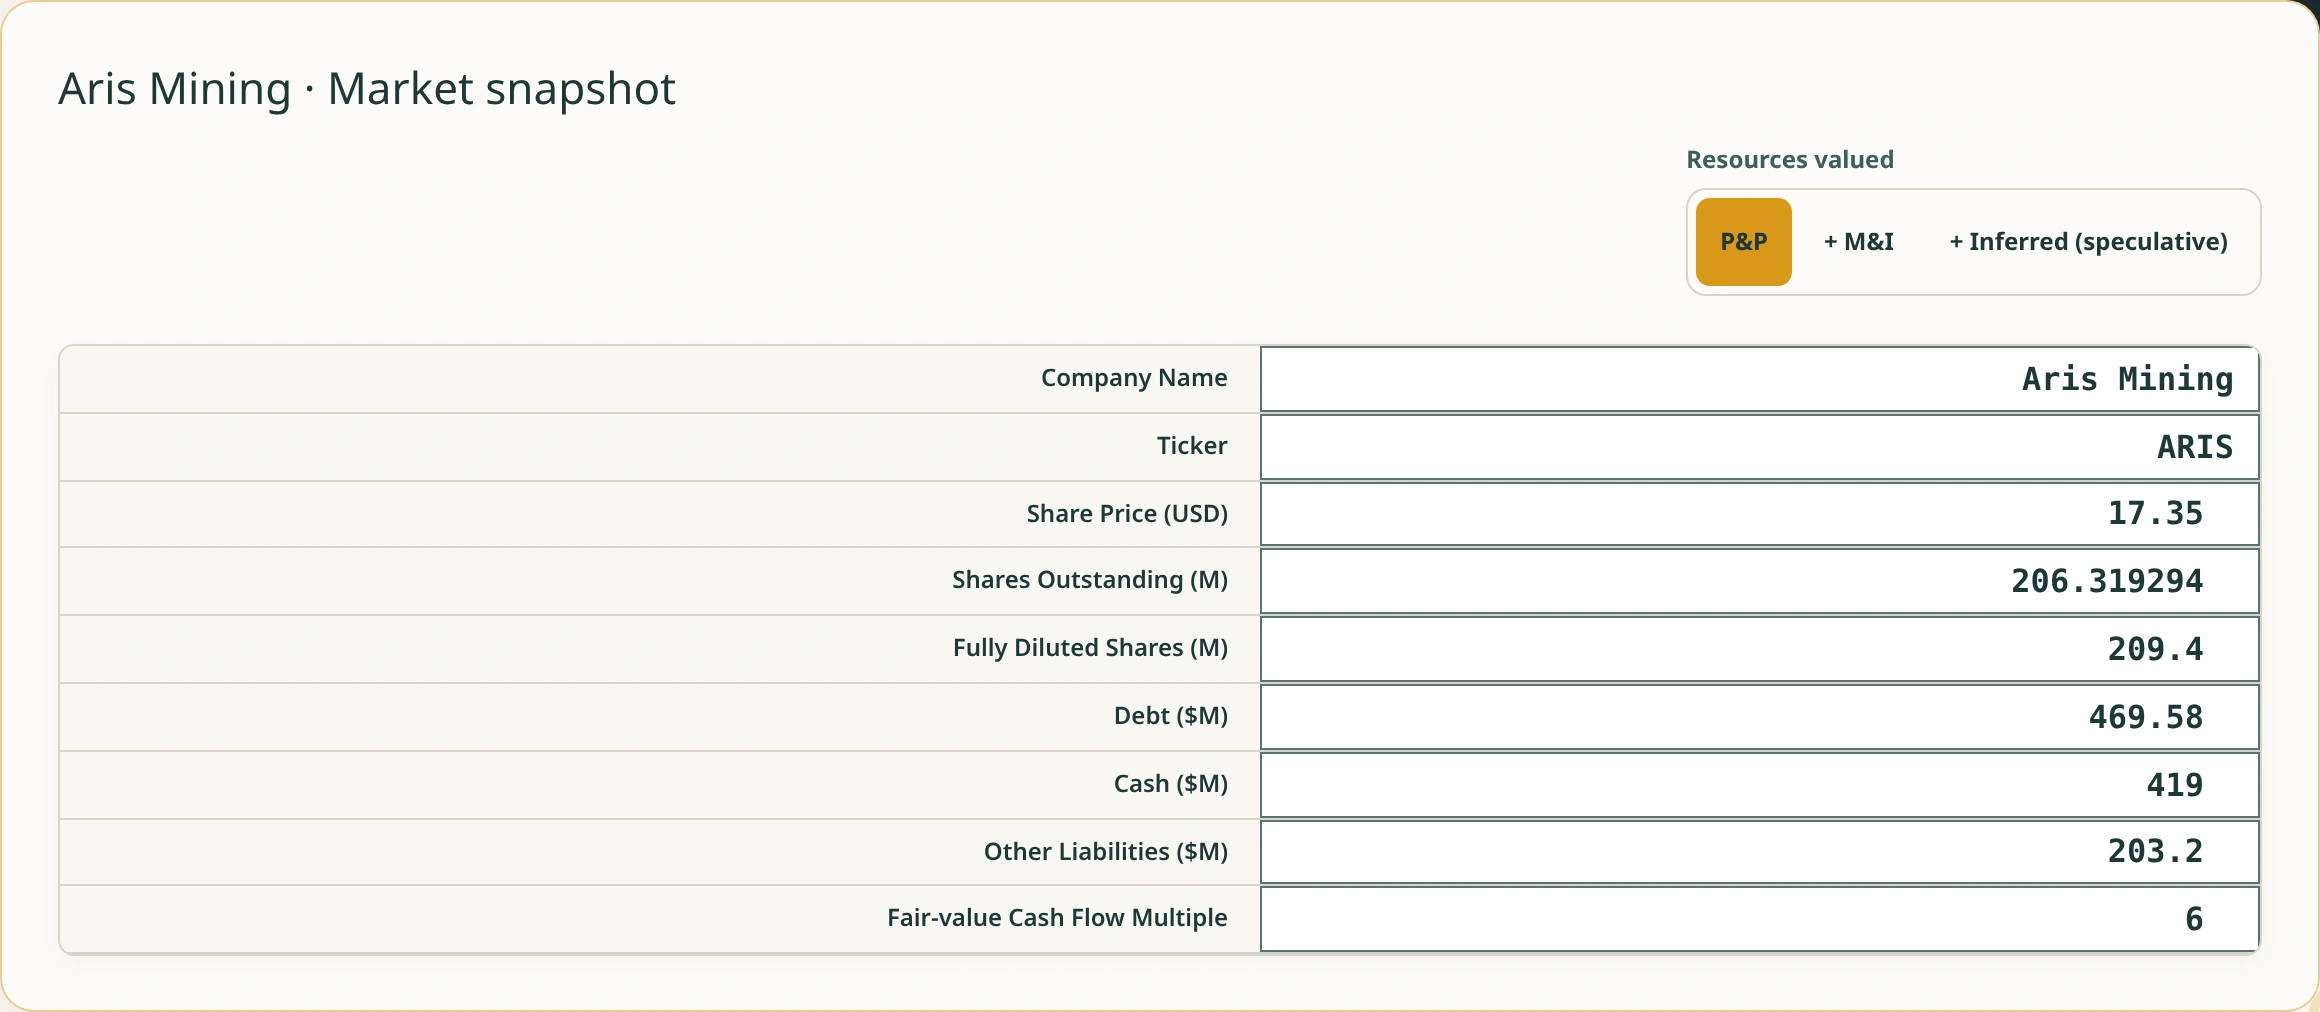
Begin with the market and balance sheet inputs; the calculator derives market capitalisation and enterprise value.
You enter
| Input | Aris value | Source tag |
|---|---|---|
| Share price (US$/share) | 17.35 | Reported |
| Basic shares (million) | 206.3 | Reported |
| Fully diluted shares (million) | 209.4 | Reported |
| Debt · cash · other liabilities (US$M) | 469.6 · 419.0 · 203.2 | Reported |
| Fair-value cash-flow multiple | 6× | Assumption |
The model computes
Step 1, market snapshot: share price US$17.35 × 206.3 million basic shares = US$3,580 million market capitalisation. Adding debt US$469.6 million, subtracting cash US$419.0 million and adding other liabilities US$203.2 million gives enterprise value of US$3,833 million. Fully diluted shares are 209.4 million.
What moves this step
Resource inventory
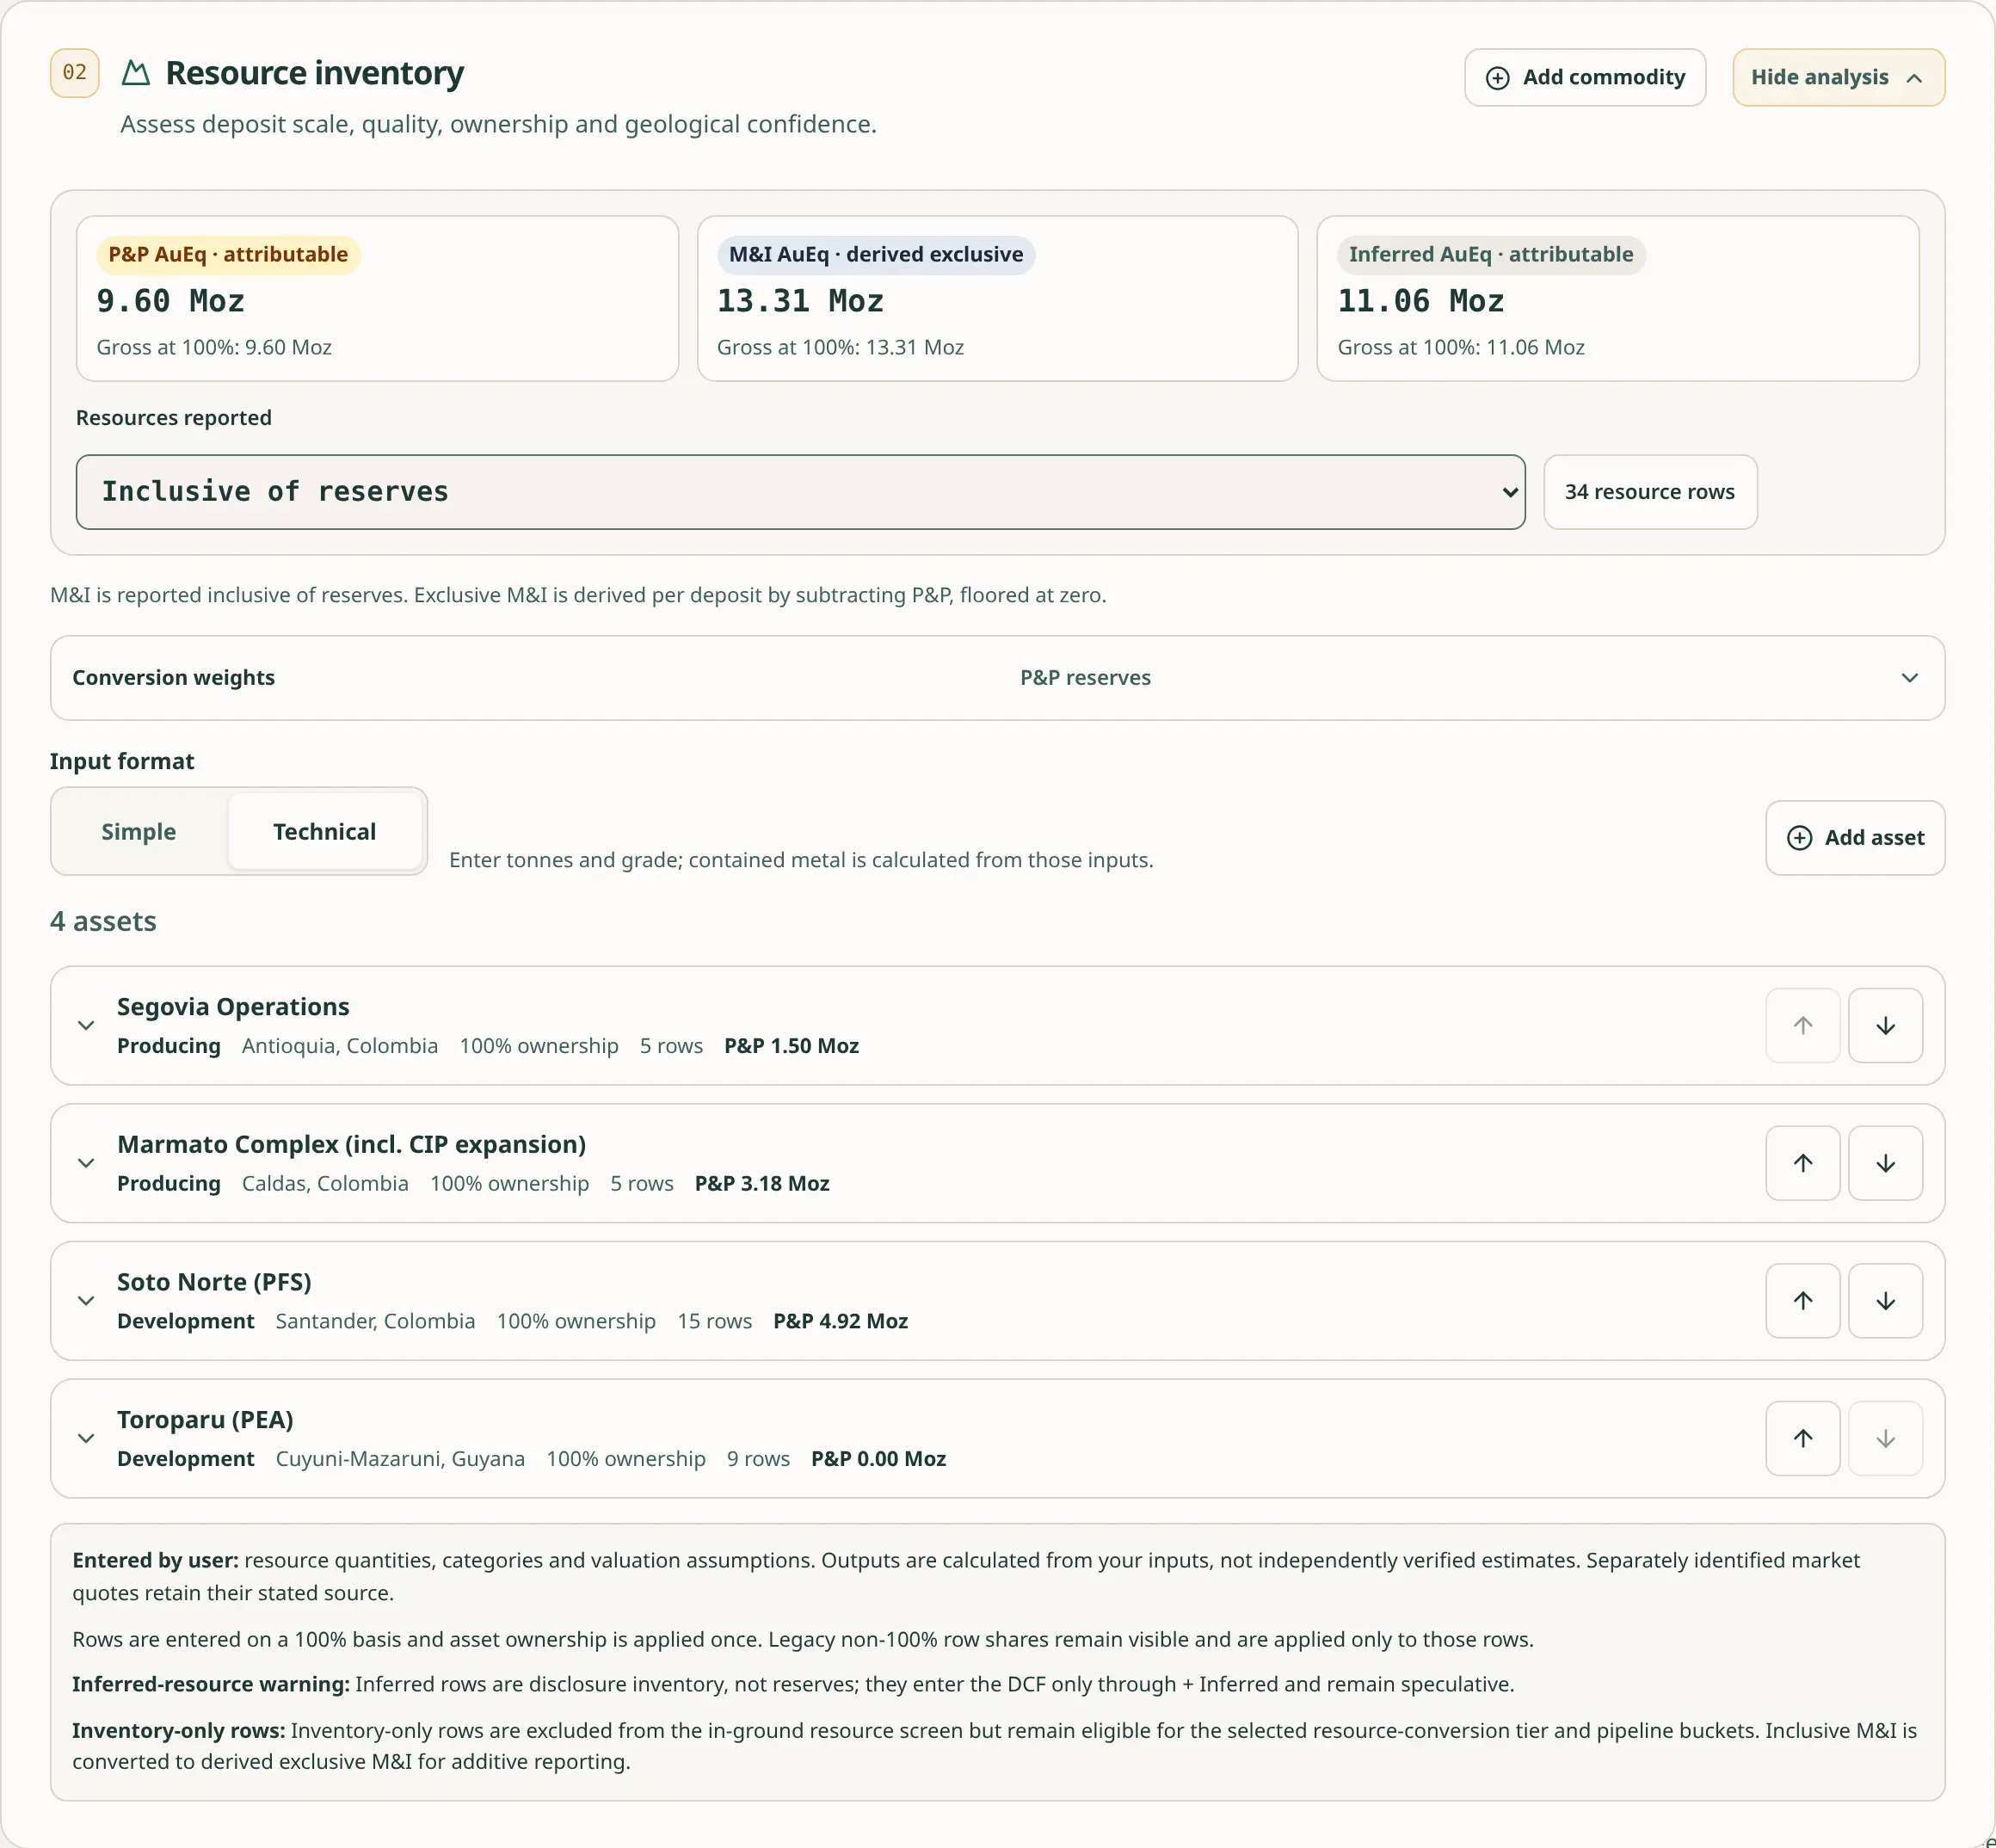
Record each resource category separately, keeping reserves distinct from measured, indicated and inferred material.
You enter
| Input | Aris value | Source tag |
|---|---|---|
| Gold reserves · P&P (Moz) | 9.24 | Reported |
| Resources valued in base case | P&P | Assumption |
| Reserve screen category weight | 78% | Assumption |
| M&I / inferred extension weights | Not applied in P&P | Assumption |
The model computes
What moves this step
Build & operate
Enter production, costs, capital, tax and timing to derive annual free cash flow and discounted asset NPVs.
You enter
| Input | Aris value | Source tag |
|---|---|---|
| Segovia production | 300 koz/y | Guidance |
| Segovia AISC · reserve life | US$1,974/oz · 5y | Reported |
| Segovia growth capex | US$45.4M/y | Guidance |
| Marmato production | 200 koz/y | Guidance |
| Marmato steady-state AISC | US$1,400/oz | Assumption |
| Marmato expansion capex · schedule | US$118M · 0.45, 0.85, then 1.0 over 15y | Guidance |
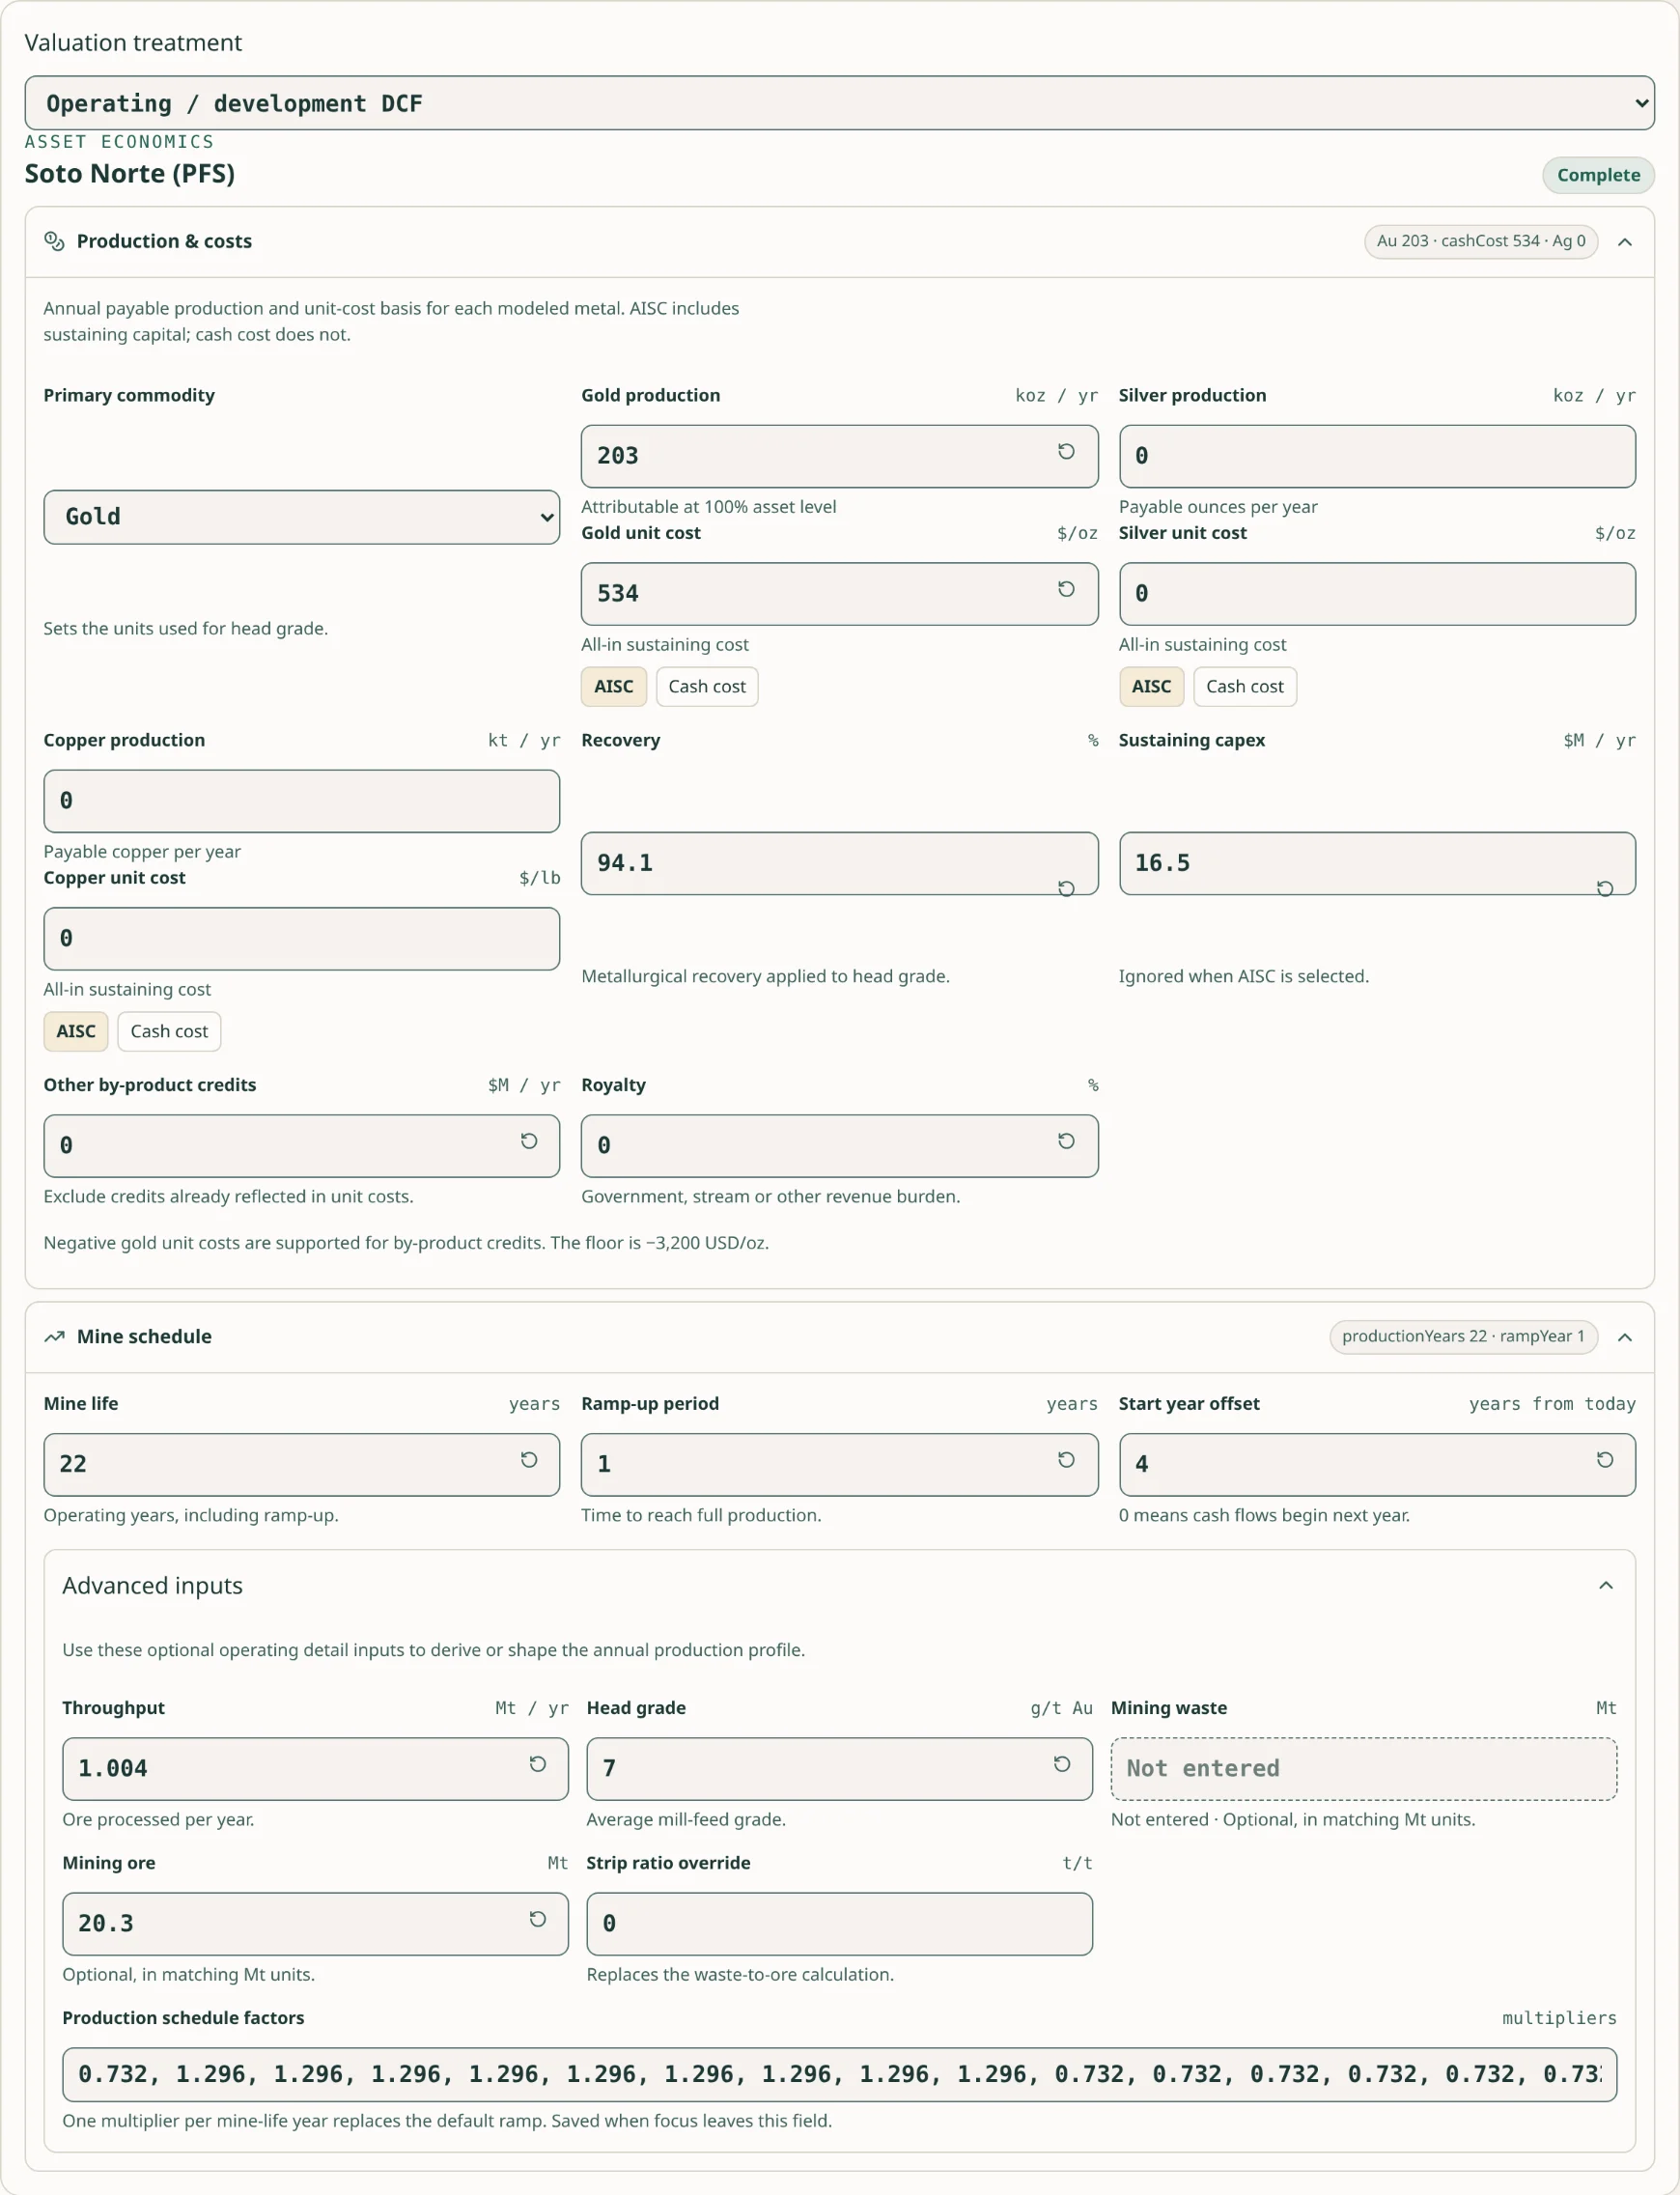
| Soto Norte production · AISC | 203 koz/y · US$534/oz | Guidance |
| Soto Norte recovery · throughput · head grade | 94.1% · 1.004 Mt/y · 7 g/t Au | Guidance |
| Soto Norte mining ore · mining waste · strip ratio | 20.3 Mt · not entered · 0 | Guidance |
| Soto Norte other metals · royalty · by-product credits | Silver 0 · copper 0 · royalty 0% · credits USD 0M/y | Assumption |
| Soto Norte sustaining capex | US$16.5M/y; ignored with AISC | Guidance |
| Soto Norte mine life · ramp-up · schedule | 22y · 1y · 1.296× in years 2–10 | Guidance |
| Soto Norte start offset | 4y | Assumption |
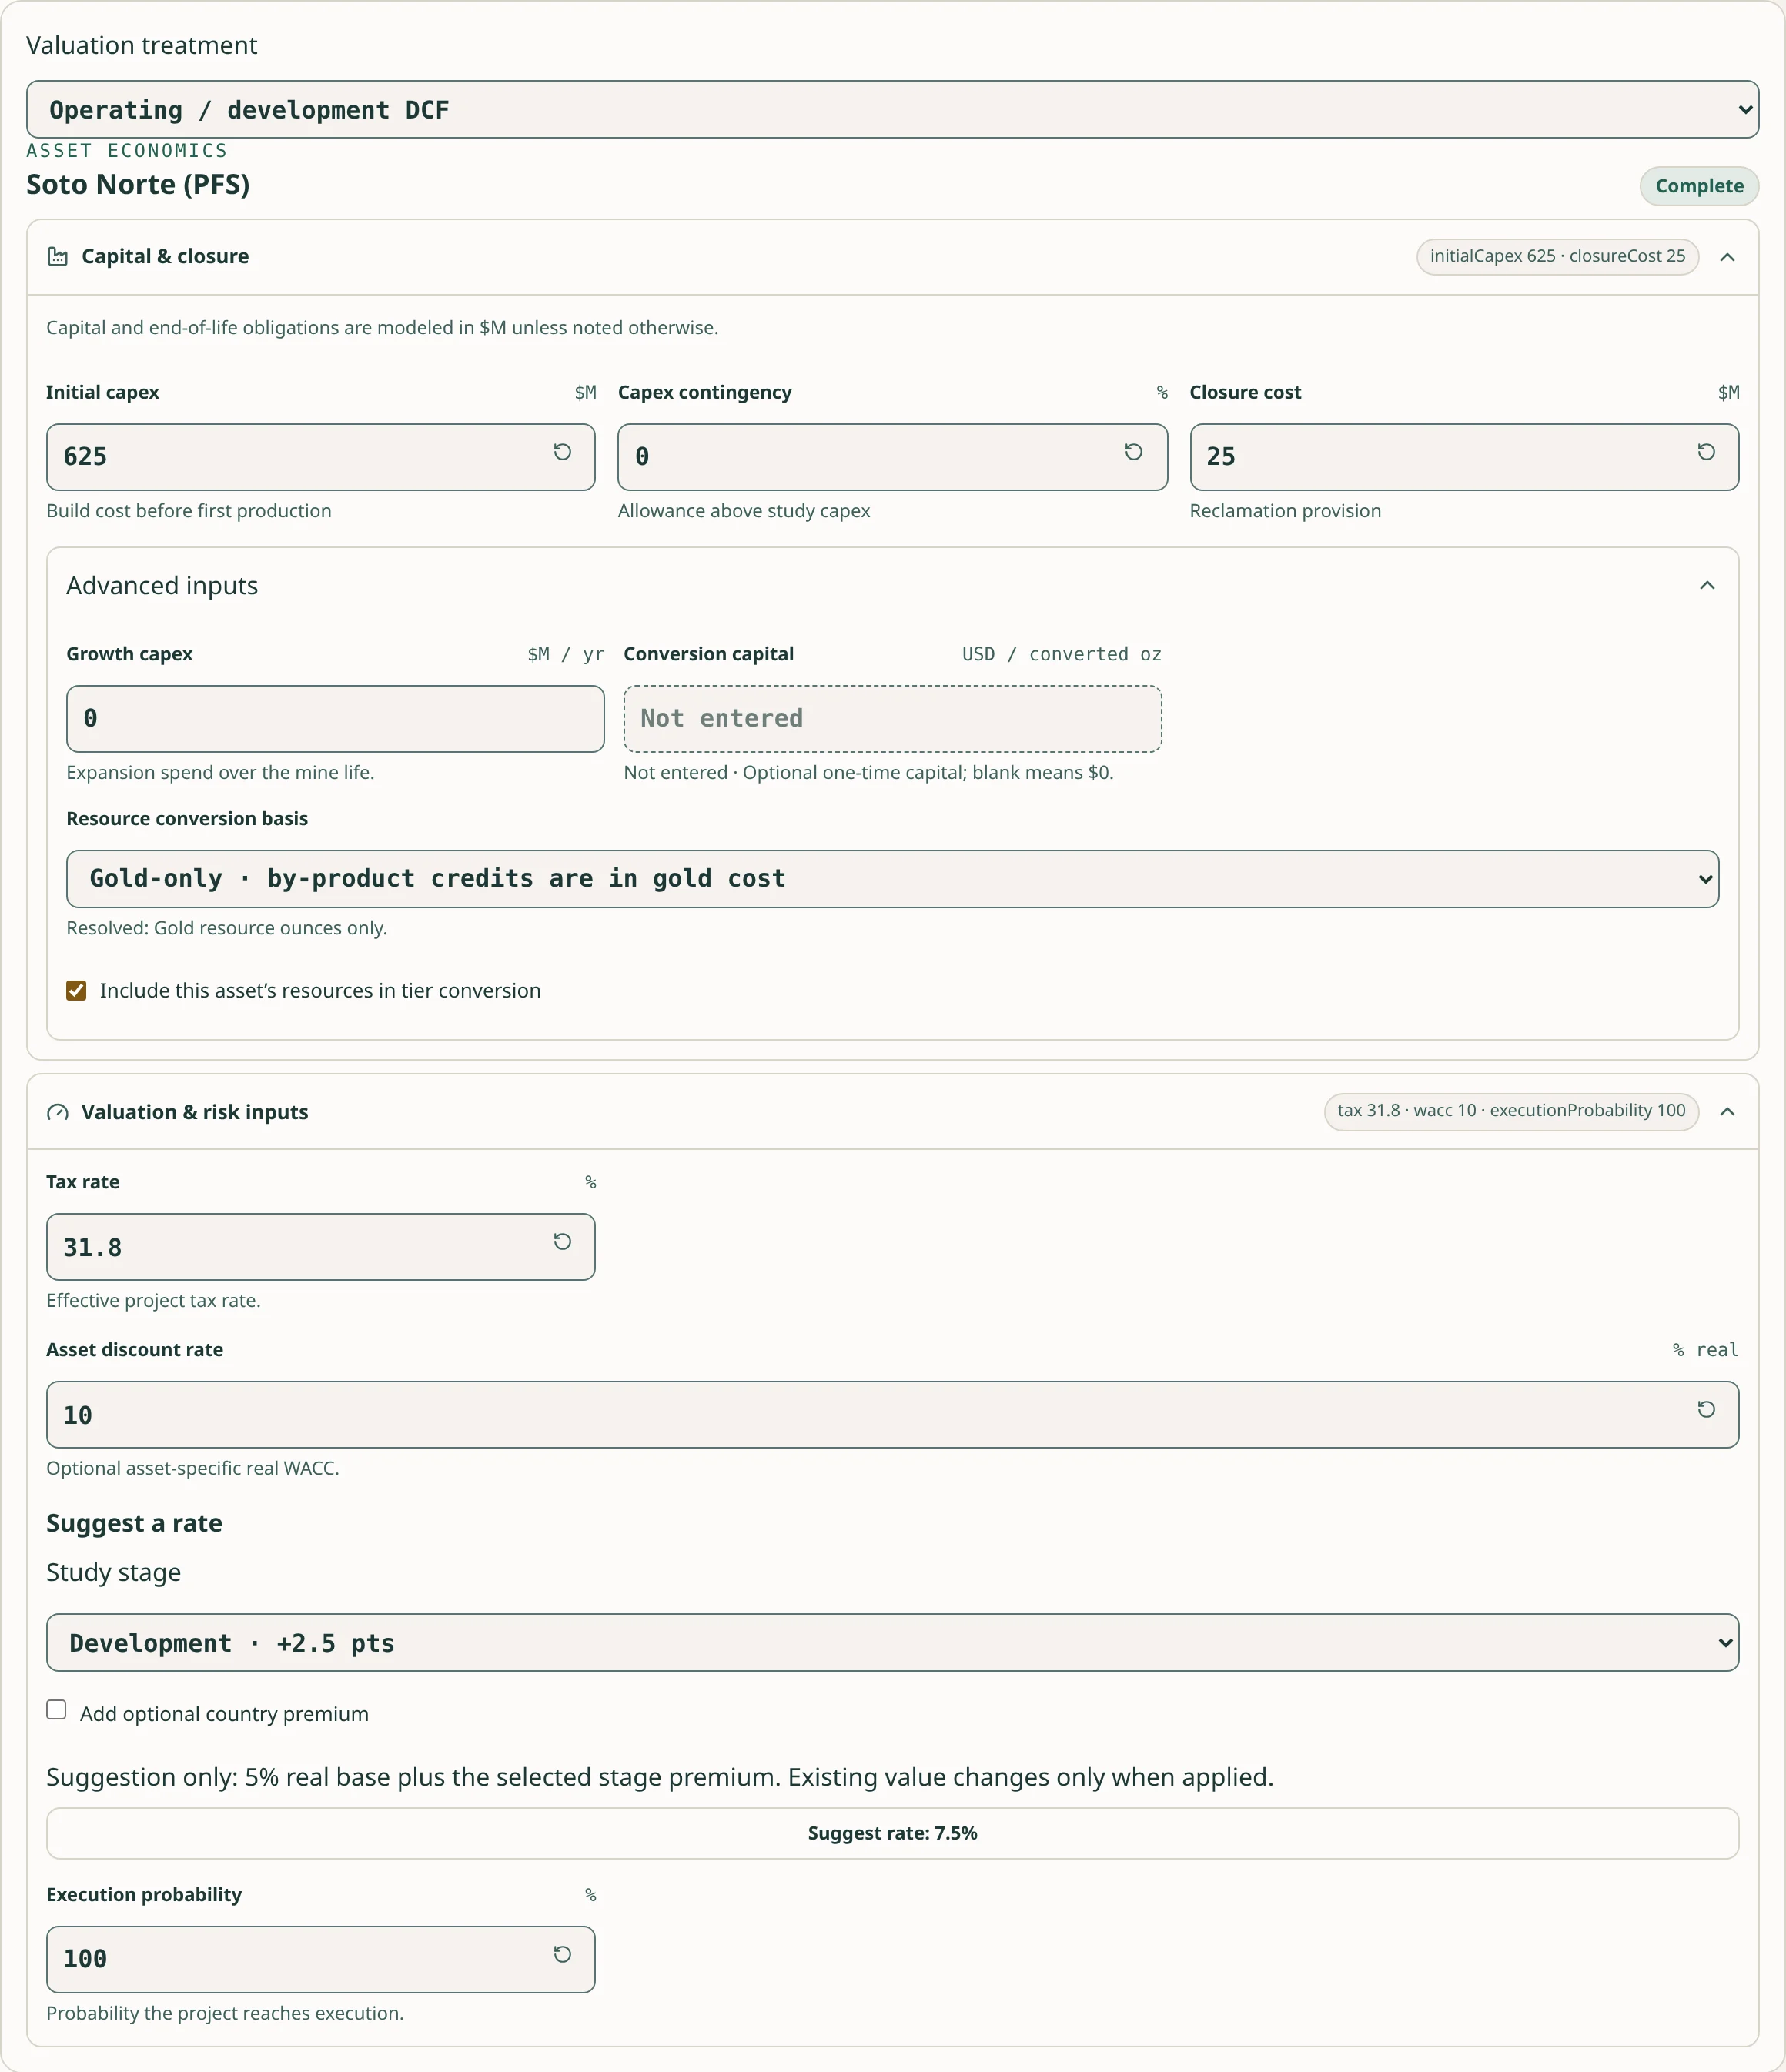
| Soto Norte initial capex | US$625M | Guidance |
| Soto Norte capex contingency | 0% | Assumption |
| Soto Norte closure · growth capex | US$25M · USD 0M/y | Assumption |
| Soto Norte tax rate | 31.8% | Guidance |
| Soto Norte asset discount rate | 10% | Assumption |
| Soto Norte conversion capital | Not entered | Assumption |
| Soto Norte resource conversion basis | Gold-only · include resources checked | Assumption |
| Marmato tax rate · shared discount rate | 33% · 10% | Assumption |
| Toroparu production · AISC · capex | 235 koz/y · US$1,289/oz · US$724M | Guidance |
| Toroparu contingency · stream royalty | 13.3% · 9.2% | Guidance |
| Toroparu mine life | 22y | Guidance |
| Toroparu start offset | 3y | Assumption |
The model computes
The four assets, as modelled, at a 10% discount rate. Costs are entered as AISC, so sustaining capex is not deducted a second time.
- Segovia (producing): 300 koz a year at US$1,974/oz AISC, 5-year reserve life, US$45.4 million a year of growth capex.
- Marmato (expanding): 200 koz a year at an assumed US$1,400/oz AISC, US$118 million to first gold from the expansion, schedule 0.45, 0.85 then 1.0 over 15 years.
- Soto Norte (PFS): 203 koz a year at US$534/oz AISC, US$625 million capex, 22-year schedule (1.296× in years 2–10).
- Toroparu (PEA): 235 koz a year at US$1,289/oz AISC, US$724 million capex plus 13.3% contingency, a 9.2% stream burden entered as a royalty, 22 years. Soto Norte has a start offset of 4 years, so its first operating cash flow is in year 5; Toroparu has a start offset of 3 years, so its first operating cash flow is in year 4.
Build & operate, annual free cash flow at the base gold price of US$4,000/oz, shown for Marmato:
- Revenue = 200 × 4,000 ÷ 1,000 = US$800 million.
- AISC cost = 200 × 1,400 ÷ 1,000 = US$280 million. No royalty.
- Pre-tax cash flow = US$520 million. Tax at 33% = US$171.6 million.
- Annual FCF = US$348.4 million.
- The same steps give Segovia US$407.2 million, Soto Norte US$479.9 million and Toroparu US$407.5 million at a 1.0 factor.
Asset NPVs (unrisked):
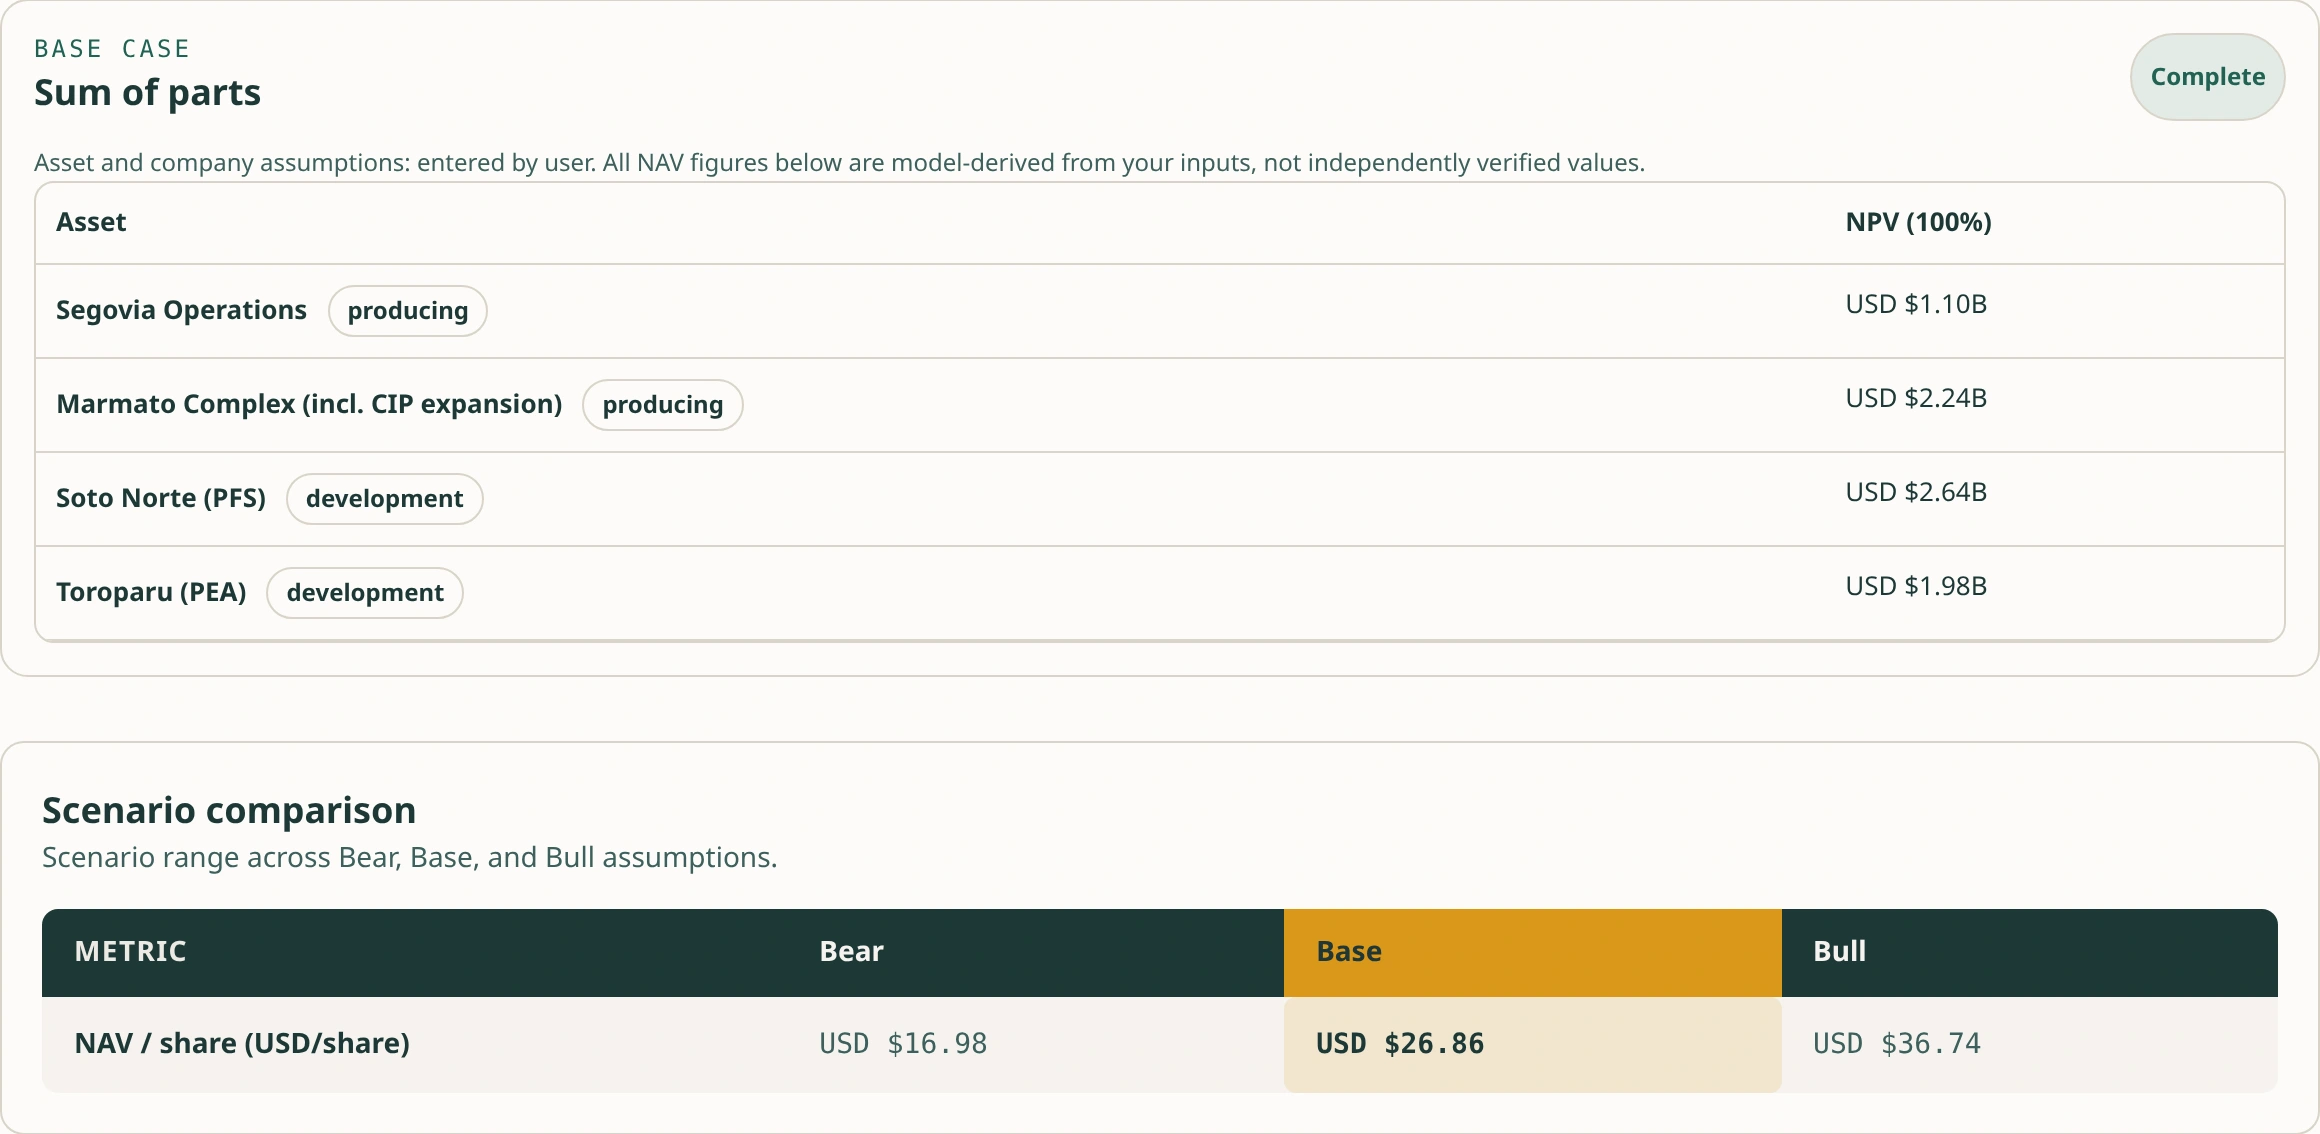
- Segovia US$1,096 million.
- Marmato US$2,238 million.
- Soto Norte US$2,643 million, after dividing by 1.10^4 for the 4-year delay.
- Toroparu US$1,978 million, after dividing by 1.10^3.
- Total US$7,956 million.
What moves this step
Risk lens
Apply the asset-specific execution and technical risk assumptions to positive project NPVs.
You enter
| Input | Aris value | Source tag |
|---|---|---|
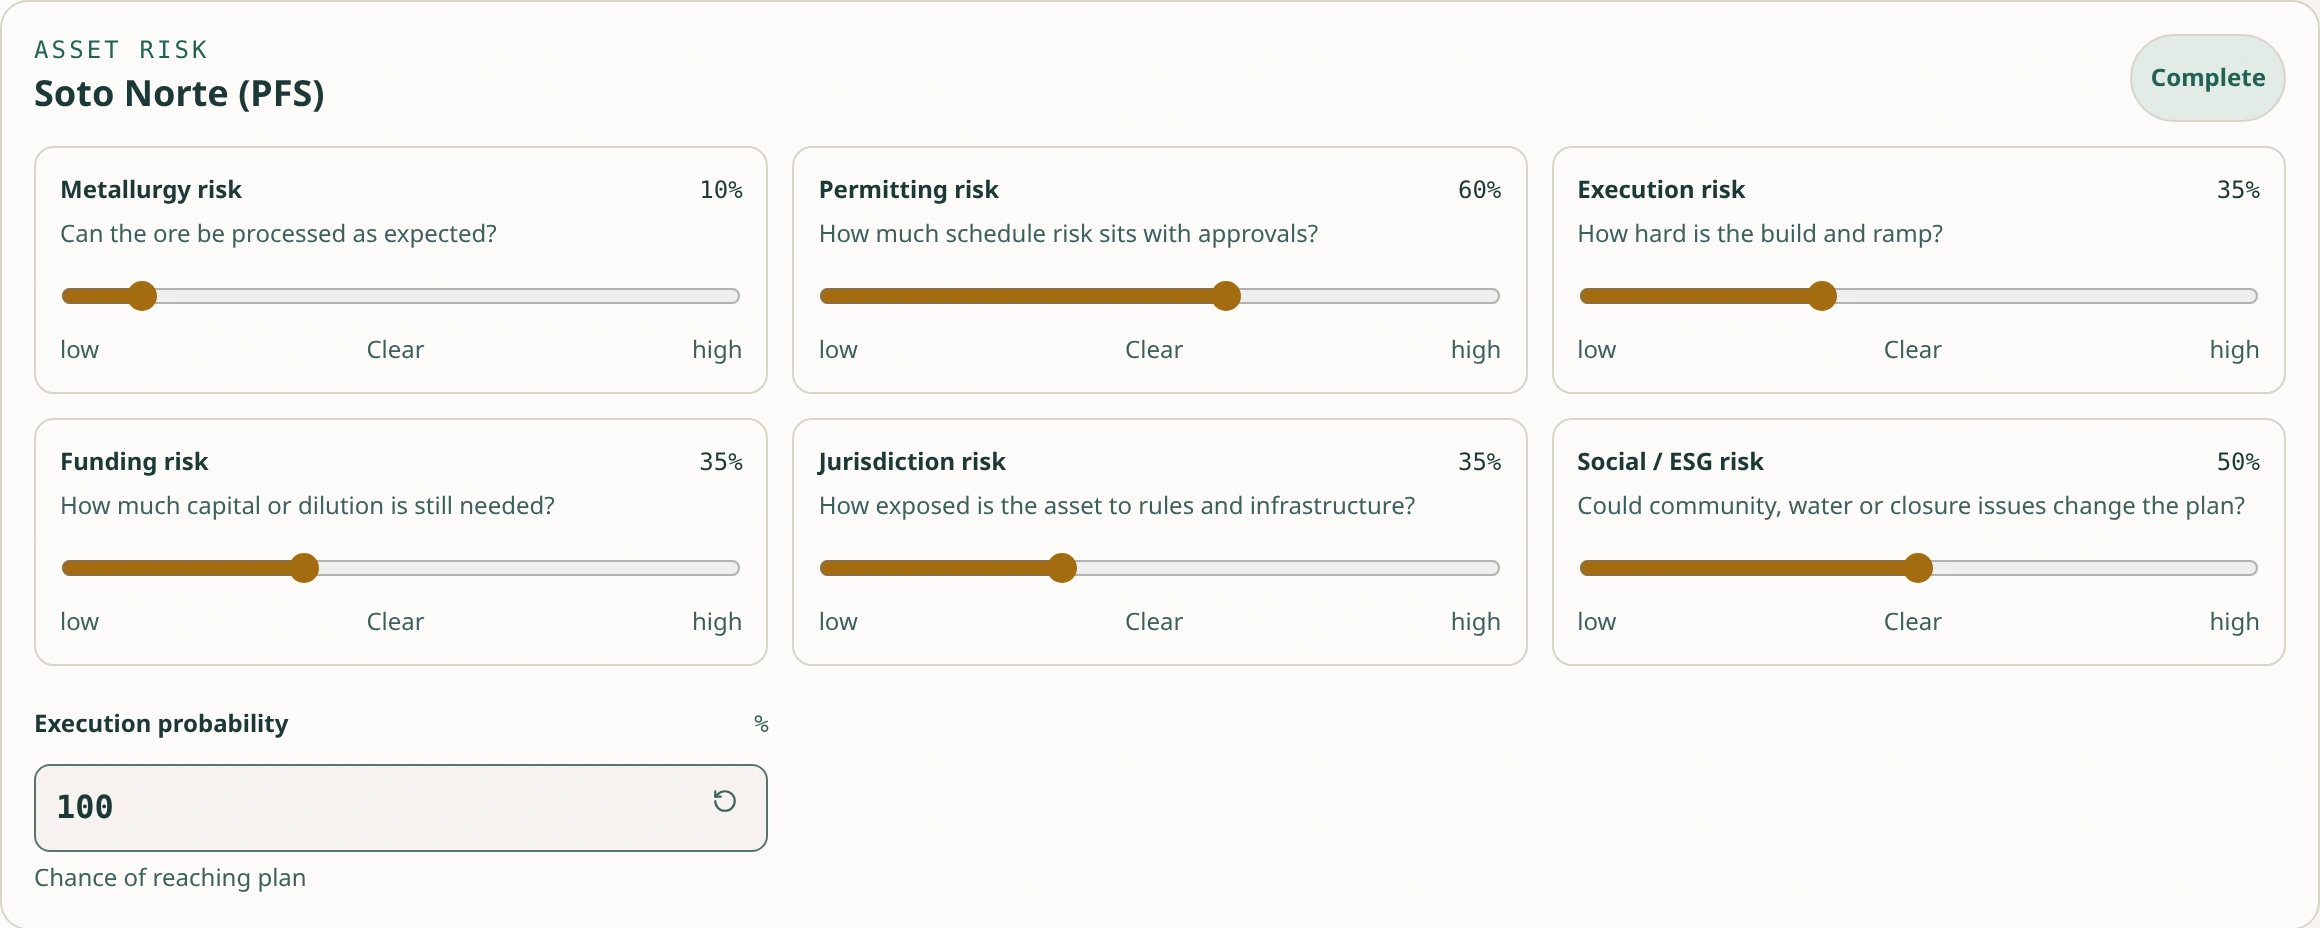
| Soto Norte execution probability | 100% | Assumption |
| Soto Norte execution risk · other five risks average | 35 · 38 | Assumption |
| Soto Norte metallurgy risk | 10 | Assumption |
| Soto Norte permitting risk | 60 | Assumption |
| Soto Norte funding risk | 35 | Assumption |
| Soto Norte jurisdiction risk | 35 | Assumption |
| Soto Norte social / ESG risk | 50 | Assumption |
| Segovia · Marmato · Soto Norte · Toroparu risk factors | 0.85 · 0.79 · 0.668 · 0.71 | Derived |
| Risked NPVs by asset (US$M) | 928 · 1,772 · 1,766 · 1,412 | Derived |
The model computes
Step 4, risk lens. Soto Norte: execution probability 100%, execution risk 35, and the other five risks average 38 (permitting 60). Its risk factor is 1.00 × (1 − 35 ÷ 200) × (1 − 38 ÷ 200) = 0.825 × 0.81 = 0.668. The other factors are Segovia 0.85, Marmato 0.79 and Toroparu 0.71. Risked NPVs: 928 + 1,772 + 1,766 + 1,412 = US$5,878 million.
What moves this step
Scenario results
Bring risked assets and balance-sheet adjustments together, then rerun the model under bear, base and bull assumptions.
You enter
| Input | Aris value | Source tag |
|---|---|---|
| Bear · gold price (US$/oz) | 3,200 · US$16.98/share | Derived |
| Base · gold price (US$/oz) | 4,000 · US$26.86/share | Derived |
| Bull · gold price (US$/oz) | 4,800 · US$36.74/share | Derived |
| Equity NAV (US$M) · NAV/share (US$) | 5,624 · 26.86 | Derived |
The model computes
Step 5, equity NAV: 5,878 + cash 419.0 − debt 469.6 − other liabilities 203.2 = US$5,624 million. Corporate G&A was left blank because it is not disclosed as an annual figure; it is optional. Dividing by 209.4 million diluted shares gives a risk-adjusted NAV per share of US$26.86.
Step 5, scenario results: the same model at US$3,200 gold (bear) gives US$16.98 per share, and at US$4,800 (bull) US$36.74. Each US$800/oz change in gold moves the result by about US$10 per share.
Single changes to the base case, each made on its own:
What the example teaches:
- The discount rate and the development projects' timing and risk move the answer more than the producing mine does.
- The flagged assumptions are where to spend your research time.
- Loading the same full input set into the calculator reproduces every number above.
One change at a time
| Change | NAV / share (US$) | Change (US$/share) |
|---|---|---|
| Marmato AISC US$1,600 instead of US$1,400 | US$26.17 | −0.69 |
| Soto Norte start offset 6 instead of 4 | US$25.40 | −1.46 |
| Toroparu start offset 5 instead of 3 | US$25.69 | −1.17 |
| Soto Norte permitting risk 30 instead of 60 | US$27.17 | +0.31 |
| Corporate G&A US$60M per year | US$24.23 | −2.63 |
| 5% discount rate on every asset | US$43.49 | +16.63 |
| Toroparu inventory only · core NAV | US$20.12 | −6.74 |
| Soto Norte conditional shares: 215.4M instead of 209.4M diluted shares (share-count-only sensitivity) | US$26.11 | −0.75 |
Conditional shares: the Q2 2026 MD&A, Outstanding Share Data, page 16 discloses 6 million shares issuable to Mubadala following receipt of Soto Norte's environmental licence. The added row assumes those shares are additional to the example's 209.4M: unchanged equity NAV of US$5,624.385M ÷ 215.4M = US$26.11. No cash proceeds are assumed. This isolates the share-count effect, not the value of licence approval or a complete pro-forma balance sheet. The 30 September 2026 update still describes environmental licensing as pending.
Options: Q2 2026 financial statements, note 13(d) and (i), pages 17–19 report 4,127,606 options outstanding at 30 June 2026, with a weighted-average exercise price of C$7.14. The quarter's 209,387,971 diluted weighted-average EPS shares already include a 2,989,561-share option effect under the treasury-stock method. That rounded 209.4M is an accounting-period reference, not a current fully diluted capital table; do not add all 4.128M options on top of it. A full reconciliation needs current grants, exercises, vesting, Canadian-dollar strikes, FX and exercise proceeds.
RSUs, PSUs and DSUs: note 13(e)–(g) reports 143,889 restricted share units, 1,663,722 performance share units and 391,920 deferred share units at 30 June 2026. Note 3 specifies cash settlement for the RSUs, and the Q2 MD&A, page 12, identifies PSUs and DSUs as cash-settled. These are cash claims, not extra shares to add to the denominator. Reconcile their liabilities against amounts already deducted before making a separate NAV adjustment.
Warrants: the Q2 MD&A, pages 12–13, confirms that all outstanding ARIS.WT.A listed warrants were exercised or expired on 29 July 2025. Do not carry that historic warrant count into this October 2026 example. The baseline, calculator import and other seven sensitivities remain unchanged.
What moves this step
NAV ledger
- 01 Market cap · EV3,580 · 3,833
- 02 Gold reserves9.24 Moz
- 03 Asset NPVs7,956
- 04 Risked NPVs5,878
- 05 Equity NAV5,624 → NAV / share US$26.86
NAV / shareUS$26.86
How every output is calculated
Calculation chain
OreScore follows five steps: 1. Market snapshot → market capitalisation and enterprise value. 2. Resource inventory → contained metal and the in-ground screen. 3. Build & operate → annual free cash flow, mine life, ramp, capital and asset NPV. 4. Risk lens → risked NPV. 5. Scenario results → ownership, corporate items and balance-sheet adjustments, equity NAV and NAV per share. Optional resource tiers add extra mine life; inventory-only assets contribute a separate pipeline value.
Bear, base and bull rerun the price-dependent resource screen and steps 3–5 using each scenario's prices, production and capital assumptions.
Every number is in US$ millions unless stated. Production is in koz (gold, silver) or kt (copper) per year. Shares are in millions. Prices and costs are per ounce or per pound.
Market snapshot
Market capitalisation = share price × basic shares outstanding.
Enterprise value = market capitalisation + debt − cash + other liabilities.
These change price-to-NAV, EV multiples and upside. They never change an asset NPV.
Debt, cash and other liabilities count only once entered, and an explicit 0 counts. Until then, enterprise value, NAV and Model value stay hidden.
Resource inventory
Contained metal = tonnes × grade × unit constant (0.0321507 for g/t → Moz; 22.0462 for % → Mlb), unless you type the contained amount directly.
The in-ground screen multiplies contained metal by scenario price, recovery, payability, ownership and a category weight (reserves 78%, M&I 58%, inferred 28%). In legacy single-mine saves, a fixed per-row price can override the scenario price in both the resource screen and reserve-AuEq calculation; clear it to use scenario prices.
The screen ignores costs, capital, tax and time, so treat it as a quick comparison of how the market values each unit of metal, not as a valuation.
Resources affect the DCF only through the + M&I and + Inferred tiers (section 8). With the default P&P tier, the DCF uses only the mine plan you entered.
Annual FCF
Revenue = gold koz × gold price ÷ 1,000 + silver koz × silver price ÷ 1,000 + copper kt × 2.20462 × copper price + by-product credits. Every term is × the scenario production multiplier.
Operating cost = each commodity's production × its unit cost (cash cost or AISC), same multiplier.
Royalty = revenue × royalty %.
Sustaining capex = entered value × production multiplier × capex multiplier. It is set to zero when any producing commodity uses AISC, because AISC already contains it.
Pre-tax cash flow = revenue − royalty − operating cost − sustaining capex.
Tax = pre-tax cash flow × tax %, only when pre-tax cash flow is positive.
To reflect depreciation, enter an effective tax rate (the study's life-of-mine tax ÷ operating margin). A discount rate cannot capture tax shields.
Annual FCF = pre-tax cash flow − tax. This steady-state value is scaled by each year's ramp or schedule factor in the DCF.
In a multi-asset model, Model value / share uses attributable annual FCF from producing assets, summed across all complete current-producing DCF assets (start offset 0), less corporate G&A. Inventory-only and pre-production assets are excluded.
If you enter throughput, head grade and recovery but not production, production is derived. Gold/silver: Mt × g/t × recovery × 1,000 ÷ 31.1035 = koz. Copper: Mt × % × recovery × 10 = kt. Derived output applies plant recovery, not payability.
Asset NPV
Year factor = min(1, year ÷ ramp-up years), or your production schedule factor for that year.
Asset NPV = Σ FCF × year factor ÷ (1 + r)^year over the mine life, − initial capex × capex multiplier × (1 + contingency), − closure ÷ (1 + r)^life, − the present value of any growth capex charged each year.
Initial capex falls at year 0, so it is not discounted.
A start offset delays the whole asset. NPV ÷ (1 + r)^offset, so the first operating cash flow lands in year offset + 1.
Each asset uses its own discount rate. A producer at 5% and a frontier project at 10% can sit in the same company.
IRR is shown only for a single asset with no start offset, growth capex, custom schedule, corporate G&A or active resource extension. Otherwise, read each asset's NPV. IRR also requires positive initial capex, finite cash flows with exactly one sign change, and a reliably bracketed solution; otherwise the output is hidden with its reason.
Risk lens
Risk factor = execution probability × (1 − execution risk ÷ 200) × (1 − average of metallurgy, permitting, funding, jurisdiction and social risk ÷ 200).
Risked NPV = NPV × risk factor when NPV is positive. A negative NPV passes through unchanged.
For positive NPV, moving execution risk from 0 to 100 halves value; with the other four technical risks at zero, moving one of the five from 0 to 100 cuts risked value by 10%, and all five at 100 halve it. Execution probability scales value one-for-one.
Risked NAV needs all seven risk inputs entered. Unentered risks are not treated as zero risk.
Resource tiers
P&P (default): the DCF uses your mine plan only.
+ M&I: eligible M&I ounces × the M&I conversion weight (default 50%) become extra years at steady-state output. Eligible means gold-equivalent, after recovery, payability and ownership, and net of reserves when M&I is reported inclusive. Exclude from resource screen hides a row from the resource screen totals and value-per-ounce. It still counts toward + M&I / + Inferred extension and pipeline value.
+ Inferred: also adds inferred ounces × the inferred weight (default 20%).
Extension years = converted AuEq ounces divided by scenario-scaled annual AuEq production of gold and any mode-eligible silver/copper, using scenario metal-price ratios and consistent ounce units; an included metal need not itself contribute positive converted inventory. Extension is capped at 15 years by default. A silver or copper co-product qualifies for conversion only when its production and unit cost are explicitly recorded; throughput-derived production alone does not satisfy the production-entry check. Closure moves to the extended end of life, growth capex continues through the extension, and optional conversion capital equals the US$/converted-oz rate × converted AuEq Moz × scenario capex multiplier, in US$ millions, discounted to the year after base mine life before any start offset.
- IRR is hidden while an extension is active.
Discounting makes late ounces worth far less than today's ounces, so the tier switch usually moves NAV by much less than the ounce count suggests.
Switching back to P&P restores the original result exactly.
Inventory-only and pipeline
An asset without defensible economics can be kept in inventory-only mode. It contributes nothing to equity NAV, and a "Partial portfolio NAV" flag says its value is unknown, not zero.
Pipeline value = (study NPV × ownership if entered, otherwise attributable contained AuEq × US$150 per P&P oz, US$60 per M&I oz, US$20 per inferred oz) × the asset's risk factor. Rows excluded from the resource screen still count toward pipeline value. It needs the asset's seven risk inputs entered. A negative study NPV is not reduced.
It is reported separately as "NAV including pipeline", so core NAV stays tied to mine plans.
Scenarios
Each scenario sets gold, silver and copper prices, a production multiplier and a capex multiplier. Every asset is recalculated with them.
Read the spread, not the midpoint. If the investment case works only in the bull case, the prices and capital in that case are the thesis.
Optional funding & dilution: Aris example
Funding & dilution is a separate Gold analysis below the Bear, Base and Bull Scenario results. Its inputs start blank. Funding required and a positive raise price activate it; the original NAV per share, Model value per share, P/NAV and IRR remain untouched.
Funding suggestion = max(0, attributable initial capex including contingency + attributable growth capex for non-producing DCF assets − cash). Producing and inventory-only assets are excluded. The Aris four-asset example suggests US$1,035.592M, but that suggestion is not applied. Single-mine models have no production-status field and use their entered build cost for this suggestion only.
For illustration, enter US$1,000M funding, 100% equity, a 10% raise discount and 5% issue costs. At the example's US$17.35 share price, accepting the price suggestion sets the raise price to US$15.615. Discount is a suggestion tool, not a second adjustment to the entered raise price.
Equity raised = 1,000 × 100% = US$1,000M. New shares = 1,000 ÷ 15.615 = 64.040986M. Existing fully diluted shares are 209.4M, so pro-forma shares are 273.440986M and dilution is 64.040986 ÷ 209.4 × 100 = 30.583088%.
Net proceeds = 1,000 × (1 − 5%) = US$950M. Base risk-adjusted equity NAV is US$5,624.385318M. Funded base NAV/share = (5,624.385318 + 950) ÷ 273.440986 = US$24.043160, versus unchanged ordinary base NAV/share of US$26.859529. Change is −10.485549%; funded P/NAV is 17.35 ÷ 24.043160 = 0.721619×.
Bear funded NAV/share is US$16.480321 (−2.964125%, funded P/NAV 1.052771×); bull is US$31.605999 (−13.962908%, funded P/NAV 0.548946×). Ordinary Bear/Base/Bull NAV/share remains US$16.98 / US$26.86 / US$36.74 when rounded to two decimals.
The raise is assumed to happen today. Asset NPVs already deduct build capex, so net equity proceeds are added back once, without changing project cash flow. Non-equity financing is assumed to be debt but enters the NAV bridge only if you enter that new debt in the market snapshot.
Every suggestion is opt-in, including 100% equity and 5% issue costs. Blank equity share or issue costs, no funding, zero or negative raise price, absent fully diluted shares, or unavailable NAV give dashes. Negative funded NAV/share remains visible; percentage change needs positive original NAV/share and funded P/NAV needs positive funded NAV/share.
The Gold workbook adds blue optional input cells on Inputs and formula rows on Valuation, using the existing active-scenario selector (Inputs!B18) for Bear, Base or Bull. Its funding formulas match the app. No cash-flow, IRR or ordinary NAV formula is replaced.
How each input moves the result
Metal price: While pre-tax cash flow is positive, each year's change in FCF is approximately price change × payable production × scenario production multiplier × that year's ramp or schedule factor × (1 − royalty) × (1 − tax), converting koz to million ounces or copper kt to million pounds. Value is the discounted sum over the mine life. Low-margin mines move far more in percentage terms.
Unit cost (cash cost or AISC): A unit-cost rise reduces FCF by scenario-scaled payable production × the cost increase, using matching monetary units, reduced by the tax offset only while pre-tax cash flow is positive; each DCF year then applies its ramp or schedule factor. Choosing AISC removes the separate sustaining capex. AISC removes only sustaining capex. Don't re-enter royalty or G&A that the issuer's AISC already includes.
Production and the production multiplier: scale revenue and operating cost together. Value moves with the margin, not with revenue.
Mine life: An extra profitable operating year adds discounted cash flow; a loss-making year can reduce NAV, and closure timing also changes.
Ramp-up years and schedule: Slower ramps reduce the present value of positive operating cash flows, but can reduce early losses in a loss-making model.
Initial capex and contingency: Effective initial capex reduces year-zero asset NPV one-for-one before any start-offset discount, ownership and positive-NPV risk adjustment.
Growth capex: subtracted every year at its present value.
Closure: small effect for long-life mines, larger for short ones.
Discount rate: Higher rates reduce the present value of future positive cash flows; the direction of total NAV can differ for negative or mixed cash flows.
Start year: divides the whole asset NPV by (1 + r)^start.
Tax and royalty: tax cuts positive cash flow proportionally. Royalty cuts revenue, so it bites hardest on thin margins.
By-product credits: add to revenue, scaled by production. Do not use them with a cost already net of by-products.
Risk inputs: multiply positive NPVs only. Execution probability is the strongest single lever.
Ownership: scales the asset one-for-one.
Debt, cash, other liabilities, other assets: change equity NAV one-for-one. They never change an asset NPV.
Fully diluted shares: divide every per-share result.
Corporate G&A: subtracted once at company level. Optional, with no effect if skipped.
Resource tier and conversion weights: affect only DCF assets with resources assigned and the tier switched on. Capped by the extension limit.
Pipeline rates and study NPV: change only "NAV including pipeline".
Strip ratio, status and evidence labels: informational. They do not change the numbers.
Defaults, missing inputs and limits
Built-in fallbacks exist, such as the 8% rate, conversion weights, the 15-year cap and pipeline rates. Any output that needs an input you haven't entered stays hidden, with the reason, instead of using a fallback.
Optional inputs (G&A, growth capex, conversion capital, schedule, other assets) leave results unchanged when skipped.
The model is simplified: one steady-state cash flow scaled by year factors; tax without depreciation; no working capital, inflation or debt schedule; no grade changes beyond your schedule.
It is a transparent screening tool, not a feasibility study, and no output is a recommendation to buy or sell.
Try it with your own figures
The calculator starts with the market snapshot. Nothing is pre-filled for you, and results depend on what you enter.
Open the mining stock calculatorFrequently asked questions
- Why can my risked NAV equal my NPV?
- When the NPV is negative the risk factor is not applied, and when execution probability is 100% with all risks at zero the factor is 1.
- Why does + M&I add less value than the ounces suggest?
- Converted ounces are produced after the base mine life, so they are discounted heavily, scaled by the conversion weight and capped by the extension limit.
- Why is model value per share different from NAV per share?
- Model value applies your chosen cash-flow multiple to one year of FCF. NAV discounts the full mine plan. They answer different questions. In a multi-asset model, Model value covers producing assets only.
- Does OreScore fetch company data for me?
- Not automatically. Optional reference lookups and document or chatbot imports can propose values, but every value must be reviewed before it is used, and status labels show where each one came from.